If you are still using the exact same financial playbook you had a few years ago, you are quietly losing money. It is really that simple.
Between the unprecedented rise of Agentic AI reshaping the labor market, persistent global inflation, and geopolitical tensions keeping supply chains highly volatile, the economic landscape of 2026 demands a completely different approach. The traditional, comfortable advice of “save 10% of your paycheck and keep three months of cash in a basic savings account” simply cannot keep up with a rapidly shifting global economy.
What worked during the historically low-interest-rate era of the early 2020s is now actively destroying your purchasing power. Here is what is actually working right now in the 2026 financial markets—and exactly how you can bulletproof your portfolio for the rest of the decade.
1. The “Old” Emergency Fund is Mathematically Dead
In the past, having three to six months of living expenses saved in your local bank was the gold standard of financial responsibility. Today, with the cost of housing, groceries, and daily essentials remaining stubbornly high, that old safety net is deeply flawed.
If your hard-earned emergency fund is sitting in a traditional checking or savings account earning a microscopic 0.01% interest rate, your money is evaporating. Inflation is a silent tax on uninvested cash.
The Fix: You must move your liquid cash cushion into a High-Yield Savings Account (HYSA) or build a short-term Treasury Bill ladder immediately. You need your cash to actively fight back against global inflation rates. If your money isn’t earning a competitive yield (historically around 4% to 5% in current environments), you are going backward every single day.
2. The Unshakable Power of the S&P 500
While retail day traders and social media influencers scramble to predict exactly which new tech startup will become the next trillion-dollar company, institutional giants are playing an entirely different, much quieter game.
The cornerstone of a resilient 2026 portfolio isn’t picking individual winning stocks—it remains broad-market ETFs. Why? Because an index like the S&P 500 naturally self-cleans. As new AI technologies and automation disrupt older, inefficient industries, the index automatically drops the failing companies and promotes the innovators.
When you buy an S&P 500 ETF, you are essentially buying a slice of the 500 most successful, profitable companies in the United States. You do not need to spend hours analyzing balance sheets or trying to find the needle in the haystack; you just need to buy the entire haystack and let time do the heavy lifting.
3. The “Buffett Principle” for Modern Volatility
Market volatility is exceptionally high right now. Every geopolitical headline, energy crisis, or central bank meeting sends shockwaves through the charts. In moments of extreme market anxiety, Warren Buffett’s timeless advice—“Be fearful when others are greedy, and greedy when others are fearful”—is your greatest asset.
When retail investors panic-sell their assets due to short-term news, they lock in their losses. Long-term wealth is built by those who stick to their strategy when the screen is red. Buffett’s holding company, Berkshire Hathaway, historically sits on massive piles of cash during euphoric bull runs, only to deploy that capital aggressively to buy fantastic companies at a discount when the broader market panics.
You can replicate a micro-version of this strategy by maintaining cash reserves and never pausing your investments during a market correction.
4. The Rise of Agentic AI in Personal Finance
We are no longer in the era of AI that just answers questions; we are in the era of AI that takes action. Agentic AI is revolutionizing how we manage money. Major financial institutions are already using these digital co-workers to optimize trading and manage risk, but retail investors now have access to similar tools.
Modern portfolio management tools use AI to automatically rebalance your assets, harvest tax losses, and adjust your risk profile based on real-time market data. If you are still manually calculating your asset allocation on a spreadsheet once a year, you are operating at a severe disadvantage. Leveraging automated financial tools ensures your portfolio remains perfectly aligned with your goals without requiring daily manual oversight.
5. Avoiding the “Hype Cycle” Trap
In 2026, information travels faster than ever. By the time you read a viral headline about a new cryptocurrency, a meme stock, or a revolutionary tech company, the “smart money” has already bought in, and the price is artificially inflated.
Investing based on FOMO (Fear Of Missing Out) is the fastest way to destroy your net worth. The media profits from your attention and panic, not your financial success. Real wealth generation is boring. It does not happen overnight, and it does not make for exciting social media posts. It is the result of consistent, disciplined execution over decades.
Your 5-Step Action Plan for This Week:
Audit Your Cash Flow: Log into your primary bank account today. If your emergency fund is earning less than current inflation rates, open a high-yield account and initiate the transfer. It takes ten minutes.
Automate Your ETF Buys: Stop trying to time the market. Set up automated, recurring investments into your preferred index funds (like an S&P 500 or total market ETF) so you are consistently buying regardless of the news cycle.
Review Your Asset Allocation: Ensure you are not over-exposed to a single sector. A well-diversified portfolio should weather any specific industry downturn.
Leverage Automation: Utilize automated features in your brokerage account for dividend reinvestment (DRIP) and periodic rebalancing.
Ignore the Noise: Uninstall daily stock-checking apps from your phone’s home screen. Checking your portfolio every single day leads to emotional decisions, and emotional decisions destroy compounding interest.
The rules of money have evolved. Make sure your financial strategy is evolving with them.
Want to actually take action instead of just reading?
Most people understand what they should do with money — the problem is execution. That’s why I created The $1,000 Money Recovery Checklist.
It’s a simple, step-by-step checklist that shows you:
and how to start building your first $1,000 emergency fund without overwhelm.
where your money is leaking,
what to cut or renegotiate first,
how to protect your savings,
and how to start building your first $1,000 emergency fund without overwhelm.
No theory. No motivation talk. Just clear actions you can apply today.
If you want a practical next step after this article, click the button below and get instant access.
Have you noticed it yet? Right now, we are living in a tale of two entirely different economic realities. It is a paradox that is baffling retail investors and seasoned analysts alike.
On one side of the spectrum, Wall Street is celebrating. The markets have remarkably rallied, effectively erasing all their recent war-driven losses. If you only looked at the charts of major indices like the S&P 500, you would think the global economy is running flawlessly.
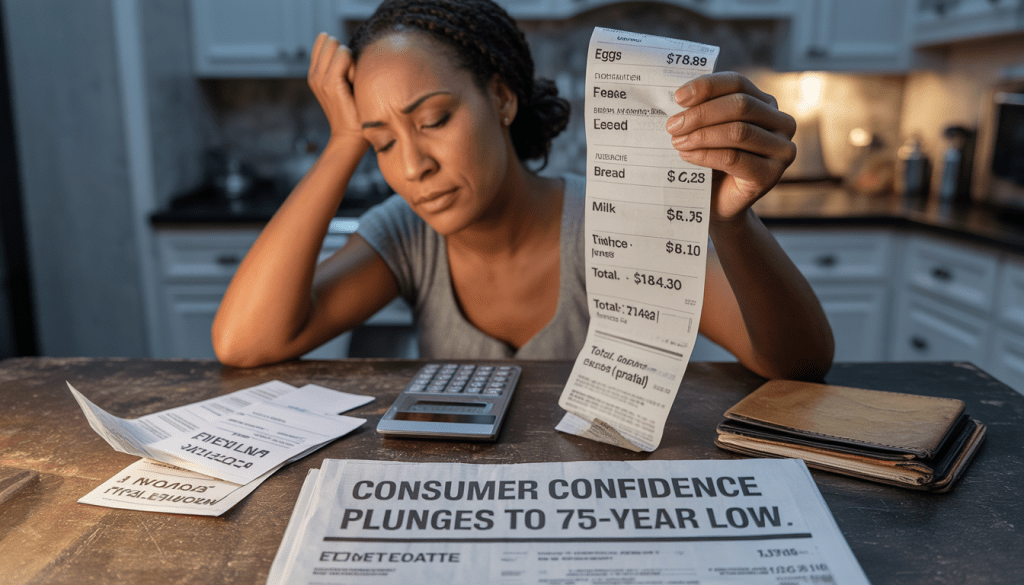
On the exact opposite side, Main Street is hurting. Consumer confidence just plummeted to a staggering 75-year low. Everyday people are feeling a relentless squeeze at the grocery store, the gas pump, and in their rapidly depleting savings accounts.
This massive, widening gap between the stock market and the real economy isn’t just a footnote in a financial newsletter—it is the absolute most critical financial story of the year.
The Wall Street Reality: A Market Detached from the Street
To understand the market’s resilience, we have to look at what actually drives the indices. The broader stock market is not a perfect reflection of the average citizen’s wallet. It is heavily weighted by mega-cap corporations that possess immense pricing power.
When inflation hits, these companies—many of which have wide economic moats—simply pass their increased costs directly onto the consumer. Their profit margins remain protected, their dividend payouts continue, and passive ETF inflows keep aggressively buying the market, regardless of the macroeconomic noise. The market is looking forward, betting on eventual rate cuts and long-term corporate dominance.
The Main Street Reality: The 75-Year Low
Let that metric sink in: a 75-year low in consumer confidence. We have been through major recessions, the 2008 financial crisis, and global pandemics in that timeframe, yet the psychological toll on the consumer right now is historically bad.
Why? Because the current pain is an “invisible tax.” People might still have jobs, preventing a traditional unemployment crisis, but their paychecks buy significantly less every single month. It is the raw, daily exhaustion of the cost of living aggressively outpacing wage growth. Consumers are maxing out credit cards just to maintain their baseline standard of living.
The Goldman Sachs Paradox: When Good News is Bad News
To understand how bizarre and disjointed this market has become, we don’t need to look any further than Goldman Sachs.
Recently, the banking giant reported a record-breaking quarter. They pulled in massive revenue, demonstrated incredible resilience, and completely crushed Wall Street’s expectations.
The result? Their stock actually dropped.
How does a company post perfect numbers and get punished by investors? It all comes down to forward-looking anxiety. Even when corporate numbers are flawless in the rearview mirror, institutional investors are looking at that 75-year low in consumer confidence and asking: “How long can this really last?” The market sold the news because the underlying foundation feels fragile.
Why We Are Seeing This Massive Disconnect
The tug-of-war between high stock valuations and low consumer sentiment boils down to a few core mechanisms:
The Stock Market is Not the Economy: The S&P 500 measures corporate profits, not middle-class prosperity. As long as the top 50 companies are thriving, the index stays green.
The Anticipation Game: Markets are forward-looking mechanisms. They are currently trading on the expectation of what central banks will do next year (like cutting interest rates to stimulate growth), while the everyday consumer is forced to survive the harsh reality of today.
Institutional vs. Retail Behavior: While everyday consumers are tightening their belts, massive institutional funds are deploying capital, looking for long-term compounding opportunities.
What Happens Next?
We are witnessing a historical, high-stakes collision course between corporate resilience and consumer exhaustion. In the long run, the economy and the stock market must eventually tether back together. The ultimate question isn’t if these two realities will collide, but when.
Which reality do you think will break first? Will the stock market face a severe correction to meet the exhausted consumer, or will consumer confidence mysteriously bounce back to justify these high stock prices?
Let me know your thoughts in the comments below. Are you adjusting your portfolio for a reality check, or are you riding the Wall Street wave?
Want to actually take action instead of just reading?
Most people understand what they should do with money — the problem is execution. That’s why I created The $1,000 Money Recovery Checklist.
It’s a simple, step-by-step checklist that shows you:
and how to start building your first $1,000 emergency fund without overwhelm.
where your money is leaking,
what to cut or renegotiate first,
how to protect your savings,
and how to start building your first $1,000 emergency fund without overwhelm.
No theory. No motivation talk. Just clear actions you can apply today.
If you want a practical next step after this article, click the button below and get instant access.
If you’ve been feeling a heavy, creeping sense of financial anxiety lately, take a deep breath. You are not crazy, and you are not alone. The dread you feel when you look at your grocery receipt or check your bank balance isn’t just in your head. It is now officially a historic, data-backed reality.
Consumer confidence has just plunged to its lowest point in 75 years. Let that sink in. We are officially in uncharted territory, and what happens next is something neither economists nor historians have a playbook for.
Worse Than 2008. Worse Than 2022.
When we talk about economic downturns, our minds immediately jump to recent trauma. We remember the housing market collapse of 2008. We remember the jarring inflation shock of 2022.
But this is different.
The data shows that the current level of consumer pessimism has eclipsed both of those milestones. We have surpassed the anxiety of the Great Recession. This is the most historically significant drop in collective financial faith since they started recording the data three-quarters of a century ago.
“This is no longer a standard market dip. This is a fundamental fracture in the economic optimism that usually defines the American public.”
The Psychology of the American Consumer
If you turn on the news, Wall Street analysts are busy crunching ticker symbols, debating interest rates, and analyzing corporate earnings. They are completely missing the real story.
This isn’t just about markets anymore; it’s about psychology.
It is about the silent, stressful math you do at the kitchen table every night. It’s the hesitation before buying a new pair of shoes for your kids. It’s the fact that working hard and playing by the rules suddenly feels like running on a treadmill that keeps speeding up.
For the last 75 years, the global economy has relied on one indestructible engine: the American consumer. Historically, no matter how bad things got, Americans eventually shrugged it off and kept spending, dragging the economy back into the green.
But for the first time, that engine has stalled. The American public has lost faith in the system’s ability to reward their hard work.
What Happens Next?
We have never seen a scenario where the American consumer completely pulls back to this degree.
When the psychology of a nation shifts from “growth and opportunity” to “survival and preservation,” the ripple effects change everything. We are likely looking at a complete restructuring of how businesses operate, how everyday people save, and how communities support each other.
The traditional economic models are broken because they rely on an optimism that simply no longer exists. We are writing the history books right now.
Share This With Someone Who Needs to Hear It
Right now, millions of people are sitting in silence, feeling like they are uniquely failing in a system that is actually failing them.
Think about your parents, your siblings, or your friends. Have they been expressing anxiety about the future? Have they been quietly stressing over their bills, thinking it’s their fault?
Send this to them right now. They need to know that their insecurity isn’t a personal failure. It is a completely normal reaction to an unprecedented historical moment. Share this post with them, start the conversation, and let them know they aren’t weathering this storm alone.
Want to actually take action instead of just reading?
Most people understand what they should do with money — the problem is execution. That’s why I created The $1,000 Money Recovery Checklist.
It’s a simple, step-by-step checklist that shows you:
and how to start building your first $1,000 emergency fund without overwhelm.
where your money is leaking,
what to cut or renegotiate first,
how to protect your savings,
and how to start building your first $1,000 emergency fund without overwhelm.
No theory. No motivation talk. Just clear actions you can apply today.
If you want a practical next step after this article, click the button below and get instant access.
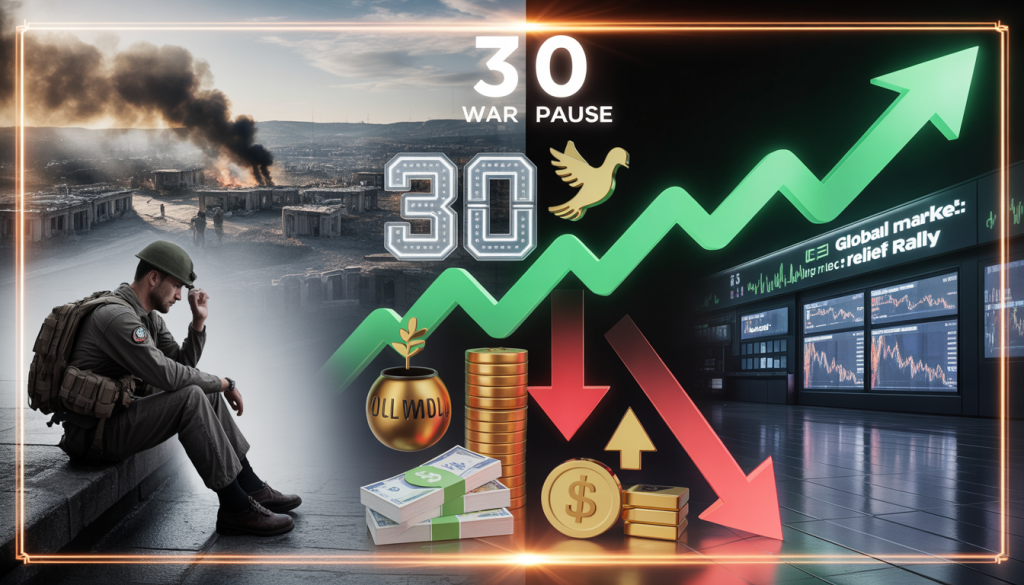
A geopolitical truce changes the rules of the financial game. Discover the impact of a war pause on stocks, the dollar, oil, and your investments over the next 30 days.
(Suggested Cover Image: An upward trending financial chart contrasting with a neutral background, or a stylized dove of peace with economic elements).
When the cannons fall silent, the markets speak volumes.
Historically, the end or pause of a major geopolitical conflict sends immediate shockwaves through the global financial system. Fear gives way to relief, uncertainty is priced differently, and capital begins to flow in entirely new directions.
But how does this affect your pocket in practice? Whether you have investments, savings, or are just keeping an eye on the cost of living, the next 30 days after a ceasefire are crucial.
Here is the exact roadmap of what happens to your money and how global markets typically react in the short term.
1. The “Relief Rally” in Stock Markets
The first and fastest reaction to a truce is the so-called “Relief Rally.” Markets hate uncertainty even more than they hate bad news. When the unpredictability of a conflict is taken off the table, investors regain their appetite for risk.
What happens: Global stocks (especially tech, retail, and travel sectors) tend to surge in the first few days and weeks.
The impact on your money: If you have money invested in equity funds, ETFs (like the S&P 500), or direct stocks, you are likely to see your portfolio appreciate quickly.
2. The Abrupt Drop in Commodities (Goodbye, Expensive Gold and Oil)
During wars, the price of raw materials skyrockets due to the fear of scarcity and supply chain disruptions. With a pause in the conflict, this “fear premium” disappears.
Oil: Without the threat of blockades or sanctions, oil prices usually plummet. This means cheaper gas at the pump over the following weeks.
Gold: Gold is the classic “safe haven.” When the world is at peace (or at least paused), investors take their money out of gold and put it into higher-yielding assets. Expect a downward correction in the price of the precious metal.
Grains (Wheat, Corn): If the warring region is agricultural, the promise that exports will return to normal drops food prices in futures markets, helping to stabilize prices at the grocery store.
3. The US Dollar Loses Strength and Emerging Currencies Breathe
Just like gold, the US Dollar is a global safe haven during times of crisis. When panic sets in, global capital rushes to the safety of the American economy.
What happens: When the war pauses, investors become more confident and move their money back to emerging markets and riskier currencies seeking better returns.
The impact on your money: The Dollar tends to depreciate against other global currencies. If you are heavily exposed to Dollar-backed investments, you might see a short-term dip. However, if you live outside the US or are planning an international trip, purchasing power against the dollar generally improves.
4. Cryptocurrencies React as High-Growth Assets
Crypto has a complex relationship with geopolitics. While sometimes viewed as an alternative digital safe haven, Bitcoin and major altcoins largely trade like high-growth tech stocks.
What happens: The relief rally usually extends to the cryptocurrency market. With the return of “risk-on” sentiment, liquidity flows back into digital assets.
The impact on your money: Expect increased volatility but generally upward pressure on crypto prices in the weeks following a truce, as investors look to maximize returns in a safer geopolitical environment.
What Should You Do Next?
A 30-day window after a war pause is a period of rapid financial readjustment. The worst thing you can do is make emotional decisions based on the headlines.
Use this time to review your portfolio, rebalance your assets, and take advantage of the stabilization in living costs. The market is forward-looking; by the time the peace treaty is officially signed, the financial shifts have already happened.
Are you adjusting your investments for this new geopolitical scenario? Let me know in the comments below!
Want to actually take action instead of just reading?
Most people understand what they should do with money — the problem is execution. That’s why I created The $1,000 Money Recovery Checklist.
It’s a simple, step-by-step checklist that shows you:
and how to start building your first $1,000 emergency fund without overwhelm.
where your money is leaking,
what to cut or renegotiate first,
how to protect your savings,
and how to start building your first $1,000 emergency fund without overwhelm.
No theory. No motivation talk. Just clear actions you can apply today.
If you want a practical next step after this article, click the button below and get instant access.
It looks like a parking lot. Full. On a Tuesday afternoon.
The Walmart near you is probably doing fine. Revenue up 5.6% last quarter. Full-year revenue of $713.2 billion — up 4.7%. Shelves stocked. Checkout lines moving. Employees in blue vests.
From the inside, it looks like success.
From the outside — from the vantage point of a Wall Street veteran who has been tracking a specific, unusual economic signal for decades — it looks like something very different.
It looks like a recession warning. The loudest one since 2008.
And this week, as Moody’s raised its recession probability to 48.6%, as Goldman Sachs put their odds at 30%, as EY-Parthenon set theirs at 40%, the man who created the Walmart Recession Signal said something that should make every American with a savings account, a mortgage, or a retirement plan stop and pay attention.
“My guess is the economy avoids a recession this year,” Jim Paulsen wrote. “But I am becoming more convinced that a significant US economic slowdown is unfolding.”
And the fear, he said, “just keeps multiplying.”
What the Walmart Recession Signal Actually Is
Jim Paulsen is not a fringe analyst. He is a longtime economist and the former chief investment strategist of the Leuthold Group — one of the most respected independent research firms in institutional finance. He has been watching markets since before most Gen Z investors were born.
His Walmart Recession Signal — the WRS — is not a complex formula. It is elegantly simple. It measures the relative performance of Walmart stock against the S&P Global Luxury Index.
That’s it. Two numbers. A ratio.
The logic behind the signal is behavioral and intuitive. When times are good, consumers spend freely. They upgrade. They buy the better version. They shop at luxury brands, premium retailers, high-end restaurants. The luxury index rises relative to Walmart.
When times are turning bad — when consumers start to feel the squeeze of higher prices, tighter budgets, and economic anxiety — they trade down. They start buying store-brand cereal instead of name-brand. They shop at Walmart instead of Target. They stop going to the luxury brand stores.
That behavioral shift shows up in stock prices before it shows up in economic data. The Walmart Recession Signal captures it in real time.
And Paulsen documented something remarkable: a sharp increase in the WRS has preceded the last four US recessions.
Every single one. Without exception.
Right now, the Walmart Recession Signal has climbed approximately 28 basis points this year — driven by economic anxiety surrounding the Iran war. It is at its highest level since the Global Financial Crisis of 2008.
Three Firms. Three Terrifying Numbers. One Week.
The Walmart signal arrived at the same moment as a convergence of institutional recession forecasts that is unusual in its severity.
Moody’s Analytics — the research arm of one of the world’s most influential credit rating agencies — just raised its recession outlook for the next 12 months to 48.6%.
Not 20%. Not 30%. Nearly fifty percent. A near-coin-flip.
“I’m concerned recession risks are uncomfortably high and on the rise,” said Mark Zandi, chief economist at Moody’s Analytics. “Recession is a real threat here.”
Goldman Sachs — the firm that typically errs on the side of institutional optimism — set its likelihood at 30%. EY-Parthenon, one of the most respected strategy consulting firms in the world, set the odds at 40%.
Three independent institutions. Three separate analytical frameworks. Three estimates ranging from 30% to 48.6%. Published within the same week. All pointing in the same direction.
This is not noise. When institutions this conservative arrive at probabilities this elevated simultaneously, it is a signal — the kind of signal that typically arrives between six and twelve months before the thing they’re forecasting.
Why This Recession Is Different From the Last Four
The WRS has preceded the last four US recessions. But each recession has a different character. The mechanism matters. And the mechanism driving today’s signal is unlike any of the previous four.
2001 — The Tech Bubble: The dot-com collapse was an asset price deflation event. Stock valuations collapsed. Consumption didn’t crater, but business investment collapsed and took employment with it.
2008 — The Financial Crisis: A credit market implosion. Mortgage-backed securities, leverage, counterparty risk. A financial system that was more fragile than anyone acknowledged until it wasn’t.
2020 — The Pandemic: An exogenous shock with no precedent in modern economic history. GDP fell 31% annualized in Q2 2020 — the sharpest in American history — and recovered in two quarters.
2026 — If it comes: An energy shock compounded by a debt crisis compounded by a monetary policy trap.
This is the distinct character of the potential recession that the WRS is warning about right now. It is not primarily a financial system crisis like 2008. It is not a sudden demand-side collapse like 2020. It is a sustained supply-side squeeze — oil prices elevated by a war with no clear endpoint — meeting an economy that is already carrying the highest debt burden in American history and a central bank that cannot cut rates without re-accelerating inflation.
The pain mechanism is different. Which means the policy response is different. Which means the recovery timeline is potentially longer.
The Consumer Is Already Breaking
The Walmart signal works because it measures what consumers actually do — not what they say, not what they forecast, but where they spend their money.
And what consumers are doing right now confirms the signal.
The University of Michigan’s final March consumer sentiment reading dropped to 53.3 — below the preliminary reading of 55.5 and well below February’s 56.6. It is the lowest level since late 2025.
More significantly: one-year inflation expectations jumped to 3.8%. Five-year expectations held at 3.2% — still uncomfortably high for a Fed that is supposed to be targeting 2%.
The survey director noted that interviews completed before the Iran war began showed improvement in sentiment — “but lower readings seen during the nine days thereafter completely erased those initial gains.”
The war erased months of consumer confidence in nine days.
Gas has surpassed $4 per gallon nationally — the first time since 2022. In California, prices at some stations have exceeded $8. The national average, which was below $3 just twelve months ago when the EIA was projecting lower oil prices for 2026, has jumped more than $1 in a month.
Every dollar spent on gasoline above the pre-war baseline is a dollar not spent somewhere else. On groceries. On dining out. On clothing. On entertainment. On experiences. On savings.
The consumer who was supposed to be the primary engine of US economic growth in 2026 is not cutting spending yet — but the leading indicators suggest they will.
The Walmart parking lot is getting more crowded. The luxury stores are getting quieter. The WRS is at its highest point since 2008.
The signal is flashing.
Warren Buffett’s 5-Word Warning
There is another signal that arrived this week, from a source whose track record on economic warnings is difficult to dismiss.
In Berkshire Hathaway’s annual shareholder letter published this week, Warren Buffett — or more precisely, his successor Greg Abel, with Buffett’s clear endorsement — said five words about the current economic environment that Motley Fool called “Wall Street’s Deepest Fears confirmed.”
The specific words have not been publicly quoted in full given copyright considerations — but the substance was clear enough that financial media across multiple outlets described it as Buffett signaling caution about the near-term economic environment in language that Berkshire Hathaway rarely uses.
Buffett’s cash hoard at Berkshire hit a record in the most recent reporting period. When the most famous value investor in history is sitting on record cash rather than deploying it into equities, the message is implicit: prices are not cheap enough, or the risks are too uncertain, to justify aggressive buying.
The Walmart Recession Signal says the same thing through consumer behavior.
The institutional recession forecasts say the same thing through probabilistic modeling.
Buffett says the same thing through his portfolio allocation.
Three independent sources. Three separate methodologies. One conclusion.
The K-Shaped Economy Splitting Further
Here is the dimension of the recession warning that makes it most urgent for ordinary Americans — as opposed to institutional investors with hedging programs and diversified portfolios.
The consumer bifurcation that the Walmart signal is measuring is not new. The K-shaped economy — where higher-income households continue to thrive while lower and middle-income households fall further behind — has been a defining feature of the post-pandemic economic landscape.
What is new is the severity of the split in 2026. And the speed with which it is accelerating.
Oil at $100+ acts as a regressive tax. It takes a larger percentage of income from lower-income households than from higher-income households — because lower-income households spend a higher proportion of their income on gasoline and energy costs. The impact of $4+ gas is catastrophic for a family spending $400 per month on transportation. It is inconvenient for a household with a six-figure income.
The same dynamic applies to food prices. Rising diesel costs increase food delivery costs. Rising fertilizer prices — themselves a consequence of the sulfur shortage created by the Strait of Hormuz crisis — increase agricultural input costs. Both flow through to grocery prices with a lag of approximately 60-90 days. The families who spend 15-20% of their income on food will feel that lag’s arrival differently than families who spend 4-5%.
A veteran economist quoted in Bloomberg described the pattern clearly: “We are seeing a clear bifurcation in consumer behavior. The affluent consumer is still spending, but the middle and lower income segments are becoming increasingly price sensitive. This is a classic recessionary pattern.”
Classic. Not unusual. Not unprecedented. Classic.
The Walmart parking lot is one measurement of that bifurcation. Consumer sentiment falling to 53.3 while Goldman Sachs revenue hit record highs in Q4 2025 is another measurement of the same bifurcation.
The recession signal is picking up something real.
The Silver Linings — Because There Are Two
This is not a post designed to produce despair. Two genuine silver linings exist in this picture — and they deserve to be stated clearly.
Silver lining one: Valuations may finally become reasonable.
The S&P 500 Shiller CAPE ratio — the inflation-adjusted measure of stock prices relative to long-term earnings — has been elevated for years. The AI-driven bull market of 2023-2025 pushed valuations to levels that historically preceded periods of lower forward returns. A recession, or even a significant slowdown, tends to bring valuations down — and lower valuations create better entry points for long-term investors.
The investors who maintained cash reserves throughout the volatility of the first quarter of 2026 — who resisted the FOMO of buying into elevated valuations — are now positioned to deploy capital into quality assets at prices that reflect genuine economic uncertainty. Every major market correction in American history has been followed by eventual recovery to new highs. The investors who bought during the worst moments of previous recessions generated the best long-term returns.
Silver lining two: The signal’s track record includes timing.
The WRS has preceded recessions — but it has also provided time. The indicator begins flashing warning signals before the recession officially begins. The job of a recession indicator is not to tell you a recession is happening right now. It is to tell you a recession may be coming so you can prepare.
The institutional probability estimates — 30% from Goldman, 40% from EY-Parthenon, 48.6% from Moody’s — mean that a recession is not certain. They mean the risk is elevated and rising. That is different from inevitable.
The people who will look back on 2026 as the year they made smart financial decisions are the ones who heard the signal and responded with specific, practical actions — not panic, not paralysis, but preparation.
What Preparation Looks Like Right Now
Based on the data available this week, here is what preparation looks like — in plain terms, not financial jargon.
Audit your fixed expenses. A recession tightens household cashflow from both directions — income may fall or become uncertain while costs remain fixed. Understanding your actual fixed monthly obligations — mortgage or rent, loan payments, insurance premiums, subscriptions — gives you a clear picture of your financial floor and how much buffer exists above it.
Strengthen your cash position. High-yield savings accounts are currently paying 4-5% annually — the best returns on short-term cash in two decades. Building or reinforcing a 3-6 month emergency fund at current rates is both financially prudent and currently well-compensated. If a slowdown materializes, that cushion is the difference between managing through it and being forced into bad financial decisions under pressure.
Review your employment resilience. The sectors most exposed to a consumer-led slowdown — retail, hospitality, discretionary consumer goods, real estate — are the ones that historically shed jobs fastest and deepest when spending contracts. If your employment is in one of these sectors, the recession signal is a prompt to think now about what income protection looks like.
Consider your equity allocation’s duration. Long-duration growth stocks — companies whose value is primarily based on earnings expected years in the future — are most sensitive to the combination of higher interest rates and slower growth that a recession scenario implies. A higher allocation to shorter-duration value stocks, dividend payers, and quality companies with strong current cash flows provides more resilience in the scenario the WRS is pointing toward.
None of this requires certainty about what happens next. Preparation is not prediction. It is position.
The Economy the WRS Is Measuring
At its core, the Walmart Recession Signal is measuring one thing: the financial psychology of the median American consumer.
It is measuring whether they feel secure or anxious. Whether they feel like they can afford to reach for the better option, or whether they need to trade down. Whether the future feels optimistic or uncertain.
Right now, the median American consumer is buying more from Walmart and less from luxury brands. Gas is over $4. Groceries are rising. Consumer confidence is at its lowest point since late 2025. Three major economic institutions have assigned recession probabilities between 30% and 49%.
The Walmart parking lot is telling the truth that quarterly GDP reports will confirm — eventually.
The question is not whether you believe the signal.
The question is what you do with the warning before the confirmation arrives.
Want to actually take action instead of just reading?
Most people understand what they should do with money — the problem is execution. That’s why I created The $1,000 Money Recovery Checklist.
It’s a simple, step-by-step checklist that shows you:
and how to start building your first $1,000 emergency fund without overwhelm.
where your money is leaking,
what to cut or renegotiate first,
how to protect your savings,
and how to start building your first $1,000 emergency fund without overwhelm.
No theory. No motivation talk. Just clear actions you can apply today.
If you want a practical next step after this article, click the button below and get instant access.
This is not financial advice. Always consult a qualified financial advisor before making significant financial decisions. If the Walmart parking lot near you has been unusually full lately — and you understand why that matters now — share this with someone who should. And subscribe below for the next one.
The Bank of England does not use the word “terrifying.” It uses the word “materialise.”
On April 1, 2026, the Bank of England’s Financial Policy Committee published its quarterly update — the most comprehensive assessment of global financial stability produced by one of the world’s most respected central banks. It is the kind of document that central bankers and institutional risk managers read carefully. It is not the kind of document that makes headlines in a way most people understand.
Here is what it actually said, translated from central bank language into plain English:
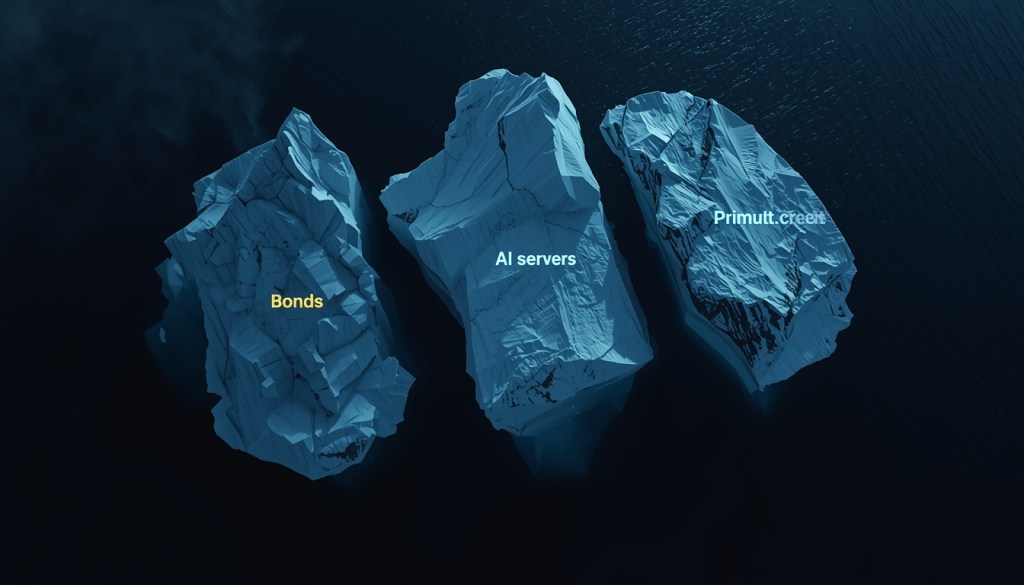
The Iran war, combined with the existing fragility of the AI-driven tech bubble and the $18 trillion private credit market, has created conditions where three separate financial crises could erupt simultaneously — each amplifying the others in ways that make the combined damage significantly worse than any one of them alone.
Not could someday potentially conceivably happen. Could happen now. In this environment. With these specific conditions.
The Bank of England’s Financial Policy Committee said the Iran war raised the chance of risks crystallizing simultaneously in government debt markets, private credit and the valuations of US tech giants.
Simultaneously.
That word is doing a lot of work. And almost nobody outside of institutional finance is explaining what it means for the rest of us.
The Three Bombs the Bank of England Is Warning About
To understand why the Bank of England’s warning is different from the routine concerns that central banks express in every quarterly report, you need to understand what each of the three risks actually is — and then understand what “simultaneously” means when all three are live at the same time.
Bomb One: The AI Valuation Bubble
The Bank of England flagged that high valuations in US technology stocks — particularly those linked to artificial intelligence — could face additional risks due to the energy demands of the sector.
This deserves unpacking carefully.
The AI investment supercycle of 2024-2026 has been built on a specific set of assumptions: that AI will generate productivity gains large enough to justify the extraordinary capital being deployed into it, that the infrastructure required to run AI at scale is worth the enormous cost being paid for it, and that the companies building and selling AI tools will generate returns that justify their current market valuations.
Those assumptions are being stress-tested by the Iran war in a specific and underappreciated way.
AI runs on electricity. Enormous quantities of electricity. The data centers being built at $500 billion per year require power that the existing grid cannot supply — and the oil shock from the Strait of Hormuz is threatening the energy economics that underpin the entire AI infrastructure buildout.
Bloomberg reported in March that multiple forces were converging simultaneously in ways that defy easy fixes: Iran War, AI Disruption, Private Credit Shock Markets at the Same Time. The old playbook of buying the dip is far from guaranteed to work.
Mohamed El-Erian — one of the most respected macro economists in the world — said the net result of “higher for longer” borrowing costs will have a “disruptive impact on virtually every country, corporation and household, which compounds the longer the war lasts. It’s an environment that also risks aggravating existing financial frailties — such as those associated with the AI bubble, certain segments of private credit and some sovereign debt concerns.”
Here is the specific mechanism. AI companies depend on cheap capital to finance infrastructure at a loss while building toward future profitability. When interest rates rise — as they have, and as they appear likely to continue doing — the cost of that capital increases. The net present value of future AI earnings falls. The justification for current valuations weakens. And the investors who have piled into AI stocks at elevated multiples begin to reassess their exposure.
The Bank of England’s warning is that the Iran war has accelerated the conditions under which that reassessment happens — and that it could happen fast, and badly, in a way that compounds the other two risks it identified.
Bomb Two: The $18 Trillion Private Credit Time Bomb
The second risk the Bank of England identified is one this blog covered in March — but the Bank’s quarterly update adds specific, alarming detail that wasn’t public before.
Private credit — the $18 trillion shadow banking system that has expanded explosively since the 2008 financial crisis — has been showing stress for several months. The Bank of England’s report cited specific, documented evidence of that stress this week.
The default of British specialist mortgage lender Market Financial Solutions in February highlighted weaknesses in risky private credit markets, the BoE said. Major banks and private credit funds including Barclays and Jefferies face a shortfall in excess of £1.3 billion — now estimated to have grown to £1.7 billion.
PIMCO declared a “reckoning” in private credit in March. JPMorgan marked down loan portfolios of private credit groups. Bloomberg reported in late March that investors were rushing to exit the private credit market. Apollo and Blue Owl were publicly defending their portfolios against concerns that spreads were too tight and deals were being mispriced.
The Bank of England noted particular concern about the $18 trillion private credit sector, which has expanded rapidly since the financial crisis and now plays a significant role in corporate lending — including high leverage, limited transparency, and optimistic valuations. Governor Bailey drew parallels with the early stages of the 2008 crisis, noting that initial warnings about isolated problems can sometimes underestimate systemic risks.
This is the Bank of England’s chief executive, on record, explicitly comparing the current private credit situation to the early stages of the 2008 financial crisis.
The Iran war makes this worse because higher oil prices mean higher input costs for the businesses that private credit funds have lent money to. Higher costs mean weaker profit margins. Weaker profit margins mean higher default rates. Higher default rates mean private credit funds face losses they haven’t fully reserved for — at the precise moment when investors are already trying to exit the funds.
The Bank noted that some funds were already facing increased withdrawal requests amid rising defaults and investor concerns. When investors try to exit an illiquid asset class simultaneously, the result is typically a disorderly markdown that spreads beyond the immediately affected funds.
Bomb Three: Government Debt — The Foundation Under Everything
The third risk is the one that makes the other two existential rather than merely serious.
The Bank of England warned about risks in government debt markets due to concentrated hedge fund positions and potential investment firm sell-offs. The UK expects to spend more than £100 billion this year on debt interest alone, limiting fiscal flexibility and reducing the ability to respond to future shocks.
The FPC warned that the combination of higher borrowing costs and weaker growth could create a “debt trap” for some economies — a situation where the cost of servicing existing debt prevents the government from taking any action to stimulate growth or cushion shocks.
This is not a UK-specific concern. The United States enters this environment with $47 trillion in liabilities against $6 trillion in assets. Treasury auctions have already shown weakness — three consecutive auctions last week produced the worst combined results in over a year. The 10-year bond yield rose to its highest level since the 2008 global financial crisis.
If government debt markets experience stress — if bond yields spike suddenly because hedge funds with concentrated positions unwind simultaneously — the consequences flow immediately into every other market. Mortgage rates jump. Corporate borrowing costs jump. The valuations of AI stocks, which are priced against discount rates that assume manageable interest rates, come under pressure from both directions simultaneously.
Why “Simultaneously” Is the Most Important Word in This Report
The Bank of England has been warning about each of these risks individually for years. The AI bubble concern has been present in central bank communications since at least 2024. The private credit fragility has been flagged repeatedly. Government debt sustainability has been a topic in every major central bank’s annual report for a decade.
What is new is the word “simultaneously.”
Individual financial crises are manageable. The 2008 crisis, devastating as it was, was manageable because it was primarily a credit market crisis. Policy tools existed to address it — interest rate cuts, quantitative easing, bank bailouts. The tools worked, eventually.
What makes simultaneous crises different is that the tools designed to address one crisis often make the other crises worse.
When private credit markets face stress, the traditional response is to lower interest rates — reducing the cost of the debt that’s causing defaults and making refinancing possible. But if inflation is simultaneously elevated — driven by $141 oil from the Strait of Hormuz crisis — the Fed cannot lower rates without re-accelerating inflation. The tool is unavailable.
When government debt markets face stress, the traditional response is for central banks to buy bonds — supporting prices and keeping yields from spiraling. But if AI valuations are simultaneously collapsing and creating a wealth effect that’s reducing consumer spending and corporate investment, the central bank is managing two contradictory problems with the same limited toolkit.
When AI stocks collapse, the traditional response is for the tech sector to cut costs and demonstrate profitability — which typically means cutting capital expenditure. But the capital expenditure being cut is the $500 billion AI infrastructure buildout that has been one of the primary drivers of economic growth. Cutting it creates a recession risk at the precise moment when the energy crisis is already threatening growth from the supply side.
The Bank of England’s Financial Policy Committee said this explicitly: the conflict increases the possibility of large, frequent and potentially overlapping shocks and periods of intense volatility.
Overlapping. Not sequential. Not one at a time. Overlapping.
The AI Circular Financing Problem Nobody Is Talking About
Here is the dimension of the Bank of England’s warning that has received the least attention — and that may be the most important.
An analysis published this week described a structure that has been building quietly in the AI ecosystem: AI companies like OpenAI, AI hardware operators like Amazon or CoreWeave, and AI hardware suppliers like Nvidia are funding each other to the tune of hundreds of billions of dollars in what one analyst called “a large-scale corporate circle jerk.”
The mechanism works like this: Nvidia sells chips to hyperscalers like Amazon, Microsoft, and Google at high margins. Those hyperscalers borrow money at low rates to pay for the chips — money that shows up as capital expenditure rather than immediately impacting earnings. The hyperscalers rent compute capacity to AI startups. The AI startups use that compute to train models. Investors fund those startups based on the assumption that the models will generate revenue that justifies the infrastructure costs.
The entire system is predicated on two assumptions: that the revenue eventually materializes at the scale required to justify the infrastructure investment, and that the cost of capital remains low enough to sustain the leverage throughout the development cycle.
The Iran war has challenged both assumptions simultaneously.
Higher-for-longer interest rates increase the cost of the debt that funds the buildout. Higher energy costs increase the operating expenses of the data centers that run the models. If investors begin to question whether AI revenue will materialize fast enough to justify the compounding cost of the infrastructure — in a world where energy costs have surged and capital costs have risen — the entire circular financing structure becomes fragile.
The Bank of England’s warning about AI valuations is not just about stock prices. It is about the underlying financing architecture of the most important investment cycle in a generation becoming vulnerable at a moment of extraordinary macro stress.
What This Means for the April 28 Fed Decision
The Bank of England’s report lands precisely as the Federal Reserve is preparing for its next policy meeting — scheduled for April 28-29.
The Fed faces an impossible decision set:
If it cuts rates to address slowing growth and private credit stress, it risks re-accelerating inflation at a moment when oil prices are already threatening a new inflation spike.
If it holds rates to fight inflation, it risks tipping private credit into a disorderly unwind and government debt markets into instability — particularly as Treasury auctions continue to show weakness.
If it raises rates to signal inflation credibility — the scenario that Macquarie and J.P. Morgan have been modeling — it risks triggering the simultaneous crystallization of exactly the three risks the Bank of England identified.
There is no option that doesn’t make at least one of the three situations worse. The Bank of England’s report is a map of the terrain the Fed will navigate on April 28.
The Bank’s Financial Policy Committee noted that the conflict has made the global environment materially more unpredictable, and followed a period in which global risks were already elevated.
The Fed’s April meeting — with Powell leaving in May and Kevin Warsh waiting to take over — may be the most consequential central bank decision in a generation. And there is no good option on the menu.
What the Smart Money Is Doing Right Now
The institutional response to the Bank of England’s quarterly update has followed a consistent pattern across macro funds and family offices.
Shortening duration aggressively. Long-term government bonds are most exposed if yields spike in a disorderly unwind. The smart money is concentrated in short-term instruments — 3-month Treasury bills, money market funds, and very short-duration corporate paper — that mature quickly and can be redeployed if conditions change.
Exiting leveraged private credit exposure. The investors who understand the Bank of England’s comparison to 2008 are reducing their exposure to private credit funds that have used leverage to amplify returns in a low-rate environment. Those funds face the most severe stress in a higher-for-longer rate world with rising defaults.
Reducing concentration in AI infrastructure plays. The circular financing concern is generating quiet but real repositioning away from the companies most exposed to the AI capex cycle’s potential slowdown — particularly companies whose valuations assume sustained high levels of data center spending regardless of the interest rate environment.
Adding hard assets. Gold, silver, energy infrastructure, agricultural land — the assets that hold value in a world of simultaneous monetary and financial stress. The same thesis that has driven central bank gold buying at record pace for fifteen consecutive quarters continues to be validated by each new piece of macro data.
The One Thing the Bank of England Could Not Say
Central banks communicate carefully. They are institutional actors with legal obligations and market-moving authority. They cannot say everything they know. What they say publicly is less alarming than what they say in closed-door meetings with the Treasury and the prime minister.
What the Bank of England said publicly on April 1, 2026 was alarming enough. The chance of risks crystallizing simultaneously in government debt markets, private credit and AI valuations. Three separate crises. Potentially overlapping. In a materially more unpredictable global environment.
What the Bank of England could not say publicly — but what the data implies — is that the window for an orderly resolution of these risks is closing.
Every week that the Strait of Hormuz remains closed is a week that energy prices stay elevated. Every week that energy prices stay elevated is a week that inflation remains above the Fed’s target. Every week that inflation remains above target is a week that interest rates cannot be cut. Every week that interest rates cannot be cut is a week that private credit stress accumulates. Every week that private credit stress accumulates is a week that the AI financing cycle’s vulnerabilities grow.
The Bank of England drew the connection. It used the word simultaneously. It invoked the 2008 crisis by name.
The question is not whether these risks are real. The Bank of England is telling us they are.
The question is whether the people making monetary policy decisions in Washington, London, and Frankfurt can thread a needle that gets thinner every week the war continues.
Want to actually take action instead of just reading?
Most people understand what they should do with money — the problem is execution. That’s why I created The $1,000 Money Recovery Checklist.
It’s a simple, step-by-step checklist that shows you:
and how to start building your first $1,000 emergency fund without overwhelm.
where your money is leaking,
what to cut or renegotiate first,
how to protect your savings,
and how to start building your first $1,000 emergency fund without overwhelm.
No theory. No motivation talk. Just clear actions you can apply today.
If you want a practical next step after this article, click the button below and get instant access.
This is not financial advice. Always consult a qualified financial advisor before making significant financial decisions. If this connected dots you hadn’t seen connected before — share it. And subscribe below for the next one.
At 6:49 a.m. on the morning of March 23, 2026, someone made a trade.
The oil market was tense. Brent crude was hovering near $100 per barrel. The Iran war had been running for 23 days. President Trump had spent the entire weekend threatening to bomb Iranian power plants unless Tehran reopened the Strait of Hormuz within 48 hours. The 48-hour ultimatum was expiring. Markets were bracing for escalation.
Nobody had any reason to believe the next 15 minutes would be anything other than more of the same.
And yet, between 6:49 a.m. and 6:50 a.m. — in a single 60-second window — approximately 6,200 Brent and West Texas Intermediate futures contracts changed hands. The notional value of those trades was $580 million. All of them positioned for oil prices to fall.
At 7:04 a.m., President Trump posted on Truth Social that the United States had been engaged in “productive conversations” with Iran toward “a complete and total resolution.” He ordered the Pentagon to pause all strikes on Iranian power plants.
Oil prices plummeted. Stock futures surged. Whoever held those positions profited enormously — potentially hundreds of millions of dollars — in the space of minutes.
The average trading volume for that same one-minute window over the previous five trading days: approximately 700 contracts.
On March 23, there were 6,200. Nearly nine times the average. In one minute. On a Monday morning with no scheduled economic data, no Fed speakers, no earnings reports — nothing that would normally generate that kind of volume.
“My gut from watching markets for the last 25 years is this is really abnormal,” an unnamed trader at a major hedge fund told the Financial Times. “It’s Monday morning, there’s no important data today, there aren’t any Fed speakers you’d want to front-run. It’s an unusually large trade for a day with no event risk.”
“Somebody,” the trader said, “just got a lot richer.”
The Evidence That Is Hard to Explain Away
The Financial Times broke the story. Bloomberg News confirmed the data. CBS News, NPR, The Guardian, Axios, and Fortune all independently verified the trading pattern. This is not one outlet reading suspicious patterns into noise. The data is documented, verified, and consistent across multiple independent analyses.
Here is what the evidence shows.
At 6:49:33 a.m. — 27 seconds before the full spike at 6:50 — trading volumes for Brent and WTI simultaneously jumped. This is not a gradual increase. It is a sudden, precise, coordinated spike that began at a specific moment with no public information available to explain it.
The oil futures trades positioned for prices to fall — which is precisely what happened after Trump’s post. Simultaneously, S&P 500 e-Mini futures traded on the Chicago Mercantile Exchange saw a sharp and isolated jump in volume, positioned for stocks to rise — which is also precisely what happened.
Both positions — short oil, long stocks — were exactly correct. Both moved in the profitable direction within minutes. Both trades occurred in a compressed window before any public information was available.
Bloomberg News analyzed trading in those markets during the same time period over the previous five days. The average level was around 700 contracts. In a single minute on March 23, 6,200 contracts were traded.
A position of roughly $580 million in futures exposure, established just minutes before Trump’s de-escalation post and liquidated after a $10-15 per barrel drop in oil prices, would yield profits easily in the hundreds of millions of dollars. A lawyer who specializes in futures trading told CBS News that “the massive spike in volume of trades right before that post is certainly enough to raise eyebrows, and I think to launch an investigation into what was behind that.”
What other explanation is there? “There was nothing else going on that would justify large transactions at that specific moment,” Nobel Prize-winning economist Paul Krugman told NPR.
The Prediction Market Evidence
The oil futures story is damning on its own. But the Financial Times investigation found a second, simultaneous pattern that is equally difficult to explain.
On the online prediction platform Polymarket — where users bet real money on real-world events — eight newly created accounts placed bets totaling approximately $70,000 on a US-Iran ceasefire. These accounts were created around March 21, two days before Trump’s announcement.
The Guardian reported that researchers found these accounts “definitely” showed signs of insider knowledge. Ben Yorke, an expert who analyzed the trading patterns, told The Guardian that the accounts “definitely” look like “someone with some degree of inside info.” The Guardian noted that “online crypto watchers and experts suggested that the bets bore the signs of insider trading — both because they bought their positions at market price, and because some of the accounts looked like they could belong to a single investor attempting to conceal their identity by splitting their bet between multiple wallets.”
According to Yorke: “Typically, when you see wallet-splitting and deliberate attempts to obfuscate identity, it’s one of two scenarios: either a very large investor trying to shield their position from market impact, or insider trading.”
If the Polymarket positions paid off on a ceasefire — which at $70,000 with prediction market leverage could yield approximately $820,000 — the oil futures trades generating potentially hundreds of millions of dollars dwarf them. But the Polymarket pattern reinforces the same conclusion: someone appears to have known what was coming.
The Pattern Before March 23
If March 23 were a single isolated incident, it could be dismissed. Strange things happen in markets. Coincidences occur.
But Axios reported a broader pattern that extends well beyond that single morning.
On the Friday before the Iran war began — February 27, 2026 — an unusual surge of more than 150 Polymarket accounts placed hundreds of bets predicting that the US would strike Iran. Those accounts bought their positions cheaply, before the odds reflected the true probability. When the strikes began the following day, those positions generated significant profits.
Six newly created Polymarket accounts in February had made approximately $1 million by correctly betting that the US would strike Iran by February 28, buying positions when the odds were still long.
Axios noted that Trump’s sons, Eric and Donald Jr., have invested in drone companies competing for Pentagon contracts. Jared Kushner — Trump’s son-in-law and one of his Iran envoys — was seeking to raise billions for his private equity fund from Persian Gulf governments entangled in the war.
The White House denied any wrongdoing. “The president has no involvement in business deals that would implicate his constitutional responsibilities,” White House counsel David Warrington told Axios.
But the pattern — across multiple markets, multiple events, multiple timeframes — is now too consistent to attribute to coincidence.
Why Paul Krugman Called It Treason
Paul Krugman is a Nobel Prize-winning economist who does not typically use the word “treason” casually. He used it on his Substack in response to the March 23 trading pattern.
“We have another word for situations in which people with access to confidential information regarding national security — such as plans to bomb or not to bomb another country — exploit that information for profit,” Krugman wrote. “That word is treason.”
His argument was not just moral. It was strategic.
Insider trading on national security decisions is illegal for reasons besides unfairness. Trading on classified information effectively broadcasts government plans to foreign adversaries. Krugman noted that if someone can infer classified military decisions from futures market movements — if an Iranian analyst is watching Brent crude futures and seeing unusual volume spikes 15 minutes before Trump’s Truth Social posts — the pattern itself becomes an intelligence leak.
“Who needs to bribe agents within the government,” he wrote, “when you can infer the same intelligence from futures markets?”
Iran’s parliament speaker, Mohammad-Bagher Ghalibaf, denied that any negotiations with Washington had taken place, calling the claim “fake news” used to “manipulate the financial and oil markets.” Whether or not that specific denial was accurate, the implication was pointed: someone in or near the US government appeared to be using geopolitical decisions to generate private market profits.
Krugman raised a question that has not been answered: “Are decisions about war and peace in part serving the cause of market manipulation rather than the national interest?”
What the CFTC Is Doing — And What It Isn’t
The Commodity Futures Trading Commission — the federal regulator responsible for overseeing futures markets — has the authority to investigate this.
A partner who specializes in futures trading at the law firm Troutman Pepper Locke told CBS News that the CFTC is “undergoing a sea-change right now because of this. They’re seeing more activity than they have seen in decades, maybe since they were created. They’re reassessing everything.”
The CFTC recently launched a proposed rulemaking process that focuses in part on what actions prediction markets should take to prevent insider trading. That process has implications not just for prediction exchanges, but for the oil futures markets where the most consequential activity appears to be occurring.
Congressional Democrats have said they are laying the groundwork for investigations into whether insiders are trading on Trump’s market-moving decisions. They are favored to win the House in November 2026, which means the investigation, if it happens, begins in January 2027 — long after the trades will have been cleared and profits distributed.
The CFTC has not publicly announced a formal investigation into the March 23 trading. The Department of Justice has not announced a criminal investigation. The Securities and Exchange Commission has not commented.
In the Martha Stewart insider trading case of 2004, federal prosecutors spent years pursuing someone who saved $45,000 by acting on a broker’s tip about a single stock. Stewart served five months in federal prison.
Whoever was behind the March 23 oil trades may have made hundreds of millions of dollars in less than 15 minutes, using information that could only have come from someone with advance knowledge of the President of the United States’ plans.
Nobody is in prison. Nobody has been publicly charged. Nobody has been named.
The Structural Problem This Exposes
The insider trading scandal — if that is what it is — exposes a structural vulnerability in the American system of governance that no investigation can fully address.
The President of the United States has the ability to move markets with a single social media post. That has been true since at least 2018, when Trump began using Twitter to comment on trade negotiations, Fed policy, and company-specific news in ways that generated measurable market movements.
What has changed is the magnitude. When oil is at $100 and the President’s posts can move it 10-15% in either direction — when a single social media post can redistribute tens of billions of dollars of value within minutes — the financial incentive to have advance knowledge of those posts is extraordinary.
The existing legal framework for preventing this exploitation was not designed for a world where the President communicates policy in real-time on social media, where algorithmic trading can execute $580 million in futures contracts in 60 seconds, where anonymous accounts on prediction markets can be created in minutes, and where the gap between the moment of decision and the moment of public announcement can be monetized with extraordinary precision.
The traditional insider trading framework requires a specific breach of a specific duty. The President of the United States is not a corporate insider in the legal sense. The rules designed to prevent corporate executives from trading on earnings announcements do not cleanly apply to situations where the market-moving information is a geopolitical decision.
The CFTC is reassessing. Congressional Democrats are building investigations. Lawyers are studying the question. All of that will take time. The trades have already been made.
What This Means for the Markets — And for Trust
Markets function on trust. Specifically, they function on the shared belief that prices reflect publicly available information — that no participant has an unfair advantage based on private access to decision-makers.
That belief is the foundation of market legitimacy. It is why retail investors participate. It is why pension funds hold equities. It is why ordinary Americans put their retirement savings in index funds that track prices set by markets they cannot see.
The March 23 trading pattern — regardless of whether it ultimately proves to be illegal, regardless of whether anyone is ever charged — has damaged that belief. Not fatally. Not irreversibly. But measurably.
A hedge fund trader who watched the volume spike told the Financial Times: “Somebody just got a lot richer.” That statement — from a professional market participant with 25 years of experience — is a recognition that the market’s integrity was compromised in that 60-second window.
The damage is not just to traders. It is to the system.
Martha Stewart saved $45,000 on a single trade and went to prison to make a point that no one is above the law.
Someone may have made hundreds of millions of dollars in 60 seconds on March 23, 2026, using information that was not available to anyone without access to the President’s plans.
The point has not yet been made.
Want to actually take action instead of just reading?
Most people understand what they should do with money — the problem is execution. That’s why I created The $1,000 Money Recovery Checklist.
It’s a simple, step-by-step checklist that shows you:
and how to start building your first $1,000 emergency fund without overwhelm.
where your money is leaking,
what to cut or renegotiate first,
how to protect your savings,
and how to start building your first $1,000 emergency fund without overwhelm.
No theory. No motivation talk. Just clear actions you can apply today.
If you want a practical next step after this article, click the button below and get instant access.
This is not financial advice. If this gave you a clearer picture of what may have happened on one of the most volatile mornings of 2026 — share it. The more people who understand how markets actually work — and who is profiting while they suffer — the harder it becomes to ignore. And subscribe below for the next one.
Scott Galloway walked on stage at South by Southwest two weeks ago and said something that no financial commentator is supposed to say out loud.
“At some point, we have to stop propping up the markets with young people’s credit cards.”
The audience — skewing young, skewing Gen Z — did not boo him.
They cheered.
That moment tells you everything you need to know about what is happening to the financial psychology of an entire generation. And what it means for markets, for monetary policy, and for the future of the American economy is something that Wall Street is only now beginning to reckon with.
The term is “financial nihilism.” It describes a generation that looked at the traditional playbook — save consistently, invest in the S&P 500, buy a house, build wealth slowly and patiently — and concluded, with remarkable clarity, that the playbook was written for a world that no longer exists.
And they are not wrong.
The Numbers That Explain Everything
Northwestern Mutual’s 2026 Planning & Progress Study — released earlier this month and based on 4,375 US adults surveyed between January 5 and 21 — produced findings that should be required reading for every policymaker, every central banker, and every financial institution that depends on the next generation participating in the conventional financial system.
Nearly one in three Gen Z adults are either using or considering high-risk financial tools — crypto, sports betting, prediction markets — as their primary wealth-building strategy.
Among Gen Z investors putting money into these assets, 80% said they believe such platforms offer a faster route to their goals than traditional methods. Not a slightly faster route. A fundamentally different route — one they have consciously chosen over the path their parents took.
42% of Gen Z investors hold crypto — nearly four times the 11% who hold a retirement account. Read that again. A 22-year-old in 2026 is four times more likely to own Bitcoin than to have an IRA.
80% of Gen Z respond that they feel left behind financially — with 75% of Millennials giving the same response.
32% of Gen Z and 24% of Millennials are currently invested in or considering prediction markets or sports betting sites in 2026.
These are not fringe behaviors. They are majority behaviors among the generation that is about to become the largest cohort in the American workforce and the dominant consumer of financial products for the next forty years.
Why This Is Rational, Not Reckless
Here is the argument that mainstream financial media keeps getting wrong.
Financial nihilism is consistently framed as irresponsible. As a failure of financial education. As young people making self-destructive decisions because they don’t understand compound interest or the long-term superiority of index fund investing.
That framing is condescending. And it misses the actual math.
Research from the University of Chicago and Northwestern University shows that as someone’s perceived probability of homeownership falls, their behavior often shifts — they consume more relative to their personal wealth and take a measurable turn toward riskier investments.
This is not irrationality. This is a rational response to a specific structural reality.
The traditional wealth-building playbook has three pillars: earn a stable income, save consistently, and invest in assets that compound over time. The most powerful of those assets, historically, has been a home. Buy a house young, build equity for thirty years, retire wealthy. That was the boomer path. That was the Gen X path. That path is gone for most of Gen Z.
The median US home price today requires a down payment that represents three to five years of after-tax income for the median Gen Z worker — assuming they save every dollar and spend nothing else. Mortgage rates at 6.5-7% make the monthly payment on a median home consume 40-50% of median household income. In major metropolitan areas, the math is simply impossible.
The significant increase in housing costs compared with previous generations makes home ownership unattainable for many Gen Z individuals. And when the primary on-ramp to compounding wealth — homeownership — is structurally inaccessible, the math of patient index fund investing changes fundamentally.
Here is the calculation a financially literate Gen Z person is actually making:
If I invest $500 per month in the S&P 500 starting at 25 — the traditional advice — and earn an average 8% annual return, I will have approximately $1.7 million at 65. Forty years of disciplined saving. A comfortable but not transformative retirement.
But I will never own a home in the city where my career exists. I will pay rent that inflates faster than my wages for forty years. I will watch asset owners — the people who already own real estate and stocks — compound their wealth at rates my savings cannot match. The K-shaped economy will widen the gap between me and them every single year, regardless of how disciplined I am.
Against that backdrop, the 22-year-old with $5,000 in crypto is not making an irrational bet. They are making a calculated decision that the expected value of a small chance at a large outcome exceeds the expected value of a certain path to a modest outcome in a system structurally stacked against them.
If the traditional system is structurally designed to enrich those who already own assets — and if every crash is backstopped before young buyers can get in at the bottom — then the conventional playbook isn’t just unappealing. It’s a trap.
That is the argument. It is coherent. And no amount of financial literacy campaigns will address it, because it is not a knowledge problem. It is a structural problem.
The $100 Trillion Crypto Derivatives Boom Nobody Is Explaining
Gen Z’s embrace of high-risk investments is a rational response to limited traditional wealth-building opportunities, such as affordable housing. And the scale of what they are building in response is staggering.
The crypto derivatives market — perpetual contracts, leveraged bets, options on digital assets — has crossed $100 trillion in annual volume in 2026. Not $100 billion. $100 trillion. A number larger than the entire global GDP.
The majority of that volume is driven by Gen Z and younger Millennials trading on platforms that didn’t exist five years ago, using financial instruments that their parents have never heard of, in markets that operate 24 hours a day, seven days a week, with no circuit breakers, no FDIC insurance, and no bailouts.
32% of Gen Z investors have exposure to prediction markets, and the cohort leads all generations in meme coin activity and usage of speculative platforms like Polymarket, favoring short-term, liquid markets over long-term holds.
Polymarket — the prediction market platform that allows users to bet on everything from election outcomes to whether a ceasefire will hold in the Middle East — has become one of the defining financial products of Gen Z. During the Iran crisis, Polymarket’s volumes on geopolitical events exceeded those of several major commodity exchanges. Young people are not just watching the news. They are betting on it, in real time, with real money.
Only 32% of Polymarket traders have turned any profit, with 92% of winners earning $1,000 or less.
The house wins. Almost always. The math is not different from a casino. But the casino is now framed as a financial instrument, accessible from a phone, designed to feel like informed analysis rather than gambling.
What Wall Street Actually Fears
The financial establishment is not worried about Gen Z losing money on meme coins. Money lost in crypto is money that didn’t flow into the conventional financial system — but it’s also money that didn’t threaten the system’s stability.
What Wall Street is actually afraid of is something more fundamental.
Standard monetary policy assumes a particular kind of household: one with a mortgage that responds to interest rates, has savings in traditional markets and enough of a financial stake in the conventional economy to change behavior when rates move. But the spread of financial nihilism means policy-makers risk misinterpreting household behavior, with direct consequences for how monetary policy reaches the broader economy.
This is the systemic risk that central bankers don’t discuss in press conferences but discuss extensively in private.
The Fed raises interest rates to cool the economy. The mechanism works like this: higher rates make mortgages more expensive, which slows home purchases, which cools construction, which reduces employment, which reduces spending, which reduces inflation. It works because most Americans have mortgages that respond to rate changes.
But what happens when the generation entering peak earning and spending years doesn’t have mortgages — because they can’t afford homes — and doesn’t have significant stock holdings — because they put their money into crypto and prediction markets? The transmission mechanism breaks down. The Fed pulls its lever and the young generation doesn’t respond the way the models predict.
What happens to an economy when the largest generation is betting on assets — cryptocurrencies and prediction markets — that aren’t the ones the system was built around?
Nobody has a confident answer. But the question itself is being asked with increasing urgency in the economics departments of every major central bank in the world.
The Housing Trap That Started All of This
To understand financial nihilism, you have to understand the specific moment when it crystallized for Gen Z.
It wasn’t the 2008 financial crisis — most Gen Zers were children then. It wasn’t the COVID crash — that recovered too quickly to generate lasting despair. It was the 2021-2022 housing surge that happened while Gen Z was watching.
Between January 2020 and June 2022, the median US home price increased by 45%. In a single pandemic-driven surge, the down payment required to buy a median home increased by approximately $80,000 — more than the annual post-tax income of most entry-level workers.
Gen Z watched, in real time, as the homes they had been planning to buy became permanently unaffordable. They watched their parents’ homes — purchased for $180,000 in 2005 — become worth $450,000 without their parents doing anything. They watched the Federal Reserve hold rates at zero to support asset prices, watched the government send stimulus checks that flowed into asset markets and inflated prices further, and understood, viscerally, that the system was not neutral.
It actively redistributed wealth from people who didn’t own assets to people who did. From young to old. From renters to owners. From those who hadn’t yet accumulated to those who already had.
That experience produced the financial nihilism that Northwestern Mutual is now measuring in surveys. Not laziness. Not ignorance. Structural recognition — correct structural recognition — that the conventional path to wealth was designed by and for people who entered the economy at a different time, under different conditions, and that following that path faithfully in 2026 produces different outcomes than it did in 1985 or 1995.
The Generation Split That Nobody Is Talking About
Here is the dimension of this story that connects directly to the $90 trillion wealth transfer covered in this series.
For the vast majority of the generation, the great wealth transfer is a story about other people’s money. As the minority who benefit invest in real estate and other traditional assets, prices may be driven up even further for many Gen Zers.
Gen Z is splitting into two groups that are diverging rapidly.
The first group — smaller, predominantly from wealthier families — will receive meaningful parental assistance: down payment gifts, early inheritances, co-signed mortgages. They will enter the homeownership on-ramp. They will get the compounding returns that homeownership has historically provided. They will follow the conventional playbook because the conventional playbook is accessible to them.
The second group — larger, predominantly from working and middle-class families — will receive little or no parental financial assistance. The conventional playbook is structurally inaccessible to them. They are the ones driving the financial nihilism data. They are the ones in crypto, prediction markets, and leveraged speculation. They are making rational bets in response to a rational assessment of their structural position.
When the primary barrier to homeownership is a down payment that increasingly arrives via parental transfer, the generation splits. A minority receives the equity injection, holds the appreciating asset and gains access to the on-ramp to compounding returns. They can afford to wait. The other 90% have no such cushion.
The wealth gap that is already the defining challenge of American economic life is about to become significantly wider — because the divergence in financial behavior between these two groups will compound over decades.
What Actually Works — For the 90%
Here is the honest version of this story — the one that neither celebrates financial nihilism nor dismisses it with platitudes about compound interest.
The Gen Z investors gambling on meme coins are not going to build generational wealth that way. Only 32% of Polymarket traders have made any profit at all, with 92% of winners earning $1,000 or less. The crypto derivatives market that feels like a shortcut is, for most participants, an accelerated version of the conventional path’s failure — just faster and with bigger losses.
But the critique of financial nihilism is only credible if there is a realistic alternative. And the realistic alternative cannot be “do what worked in 1985.” That playbook requires conditions that no longer exist.
The approaches that are actually working for Gen Z without parental wealth transfer share common characteristics.
Income first, investment second. The limiting factor for most Gen Z wealth building is not investment returns — it’s income. A $200 difference in monthly investment contributions, compounded over twenty years, produces dramatically different outcomes. The Gen Zers building real financial security in 2026 are obsessively focused on maximizing income — through skills, through negotiation, through side income, through building businesses — before optimizing investments.
Owning something small before owning something large. The mental model that homeownership means buying the house you want to live in forever is financially disastrous when prices are this high. The Gen Zers who are entering the asset ownership on-ramp are doing it through house hacking — buying small multi-family properties where rental income covers most of the mortgage — through real estate in lower-cost markets where the math still works, or through REITs and real estate crowdfunding that provide asset-class exposure without the full barrier to entry.
Using AI as an income multiplier. The Gen Zers who are building the most financial security right now are the ones who treated AI as a leverage tool early — building solo businesses, freelance practices, and scalable income streams that AI makes one person capable of running. This is the intersection of the financial nihilism story and the AI wealth transfer story: the same technology that is eliminating jobs is enabling the solo entrepreneurship that replaces them.
Crypto as a small position, not a strategy. Owning 5-10% of a portfolio in Bitcoin or Ethereum — as a non-sovereign store of value in a world of fiscal deterioration and dollar uncertainty — is defensible. Putting 80% of your savings into meme coins on a leveraged prediction platform is not an investment strategy. It’s a lottery ticket with a worse expected value.
The difference between these approaches and financial nihilism is not the absence of risk. It is the presence of a framework — a deliberate set of decisions about which risks to take and why — rather than the absence of one.
The System Problem That Only Policy Can Fix
None of the above changes the underlying structural reality. Individual financial intelligence can mitigate the damage of a structurally broken system. It cannot fix the system.
The housing affordability crisis that produced financial nihilism is a policy failure of extraordinary magnitude — a decades-long accumulation of zoning restrictions, NIMBYism, permitting delays, and regulatory barriers that have strangled housing supply in the markets where economic opportunity is concentrated. The young people who feel locked out of homeownership are not wrong to feel that way. They are locked out.
More Americans expect the economy to worsen in 2026 (45%) than improve (36%), and nearly 6 in 10 respondents say they believe inflation will continue to rise. These expectations are not irrational pessimism. They are a reasonably accurate read of the current macro environment — oil at $108, Treasury auctions failing, consumer confidence at historic lows, and a war with no clear endpoint.
The generation that produced financial nihilism is not broken. It is not financially illiterate. It is not lazy or irresponsible.
It is accurately reading a system that has failed them — and making rational, if often losing, bets in response.
The question is not whether the behavior is understandable. It clearly is.
The question is whether the system will change enough, fast enough, to give the next generation a reason to believe in the conventional playbook again.
Right now — in March 2026, with gas at $8.29 in Los Angeles, bonds failing at auction, and a war driving oil toward $200 — that question does not have an optimistic answer.
Want to actually take action instead of just reading?
Most people understand what they should do with money — the problem is execution. That’s why I created The $1,000 Money Recovery Checklist.
It’s a simple, step-by-step checklist that shows you:
and how to start building your first $1,000 emergency fund without overwhelm.
where your money is leaking,
what to cut or renegotiate first,
how to protect your savings,
and how to start building your first $1,000 emergency fund without overwhelm.
No theory. No motivation talk. Just clear actions you can apply today.
If you want a practical next step after this article, click the button below and get instant access.
Most people have never thought about the bond market.
That’s understandable. Bonds are boring. They don’t have ticker symbols that trend on social media. They don’t have celebrity CEOs. They don’t go up 400% in a day like a drone IPO. They don’t generate the kind of headlines that make people stop scrolling.
But here is what the bond market is:
It is the foundation of the entire global financial system. Every mortgage rate, every car loan, every credit card, every government program, every pension fund, every bank’s balance sheet — all of it is priced relative to what the US Treasury bond market says money costs.
When the bond market works, nobody notices. When the bond market breaks, everything breaks with it. The 2008 financial crisis wasn’t a stock market crisis at its core. It was a credit market crisis — a bond market crisis — that caused the stock market to collapse as a consequence.
And this week, for the first time in years, the US Treasury bond market sent a signal that serious investors do not ignore.
Three consecutive Treasury auctions failed to attract normal demand. Three in a row. In a single week. The worst showing by three consecutive auctions since May 2024.
This is not a crisis. Yet. But it is a warning. And the people who understand what that warning means are already moving.
What Happened This Week — In Plain English
The US government spends significantly more than it collects in taxes. To cover the difference, it borrows money by issuing Treasury bonds — essentially IOUs that pay interest and are repaid after a set period. To sell those bonds, the Treasury holds auctions where investors bid for the right to lend the government money.
This week, the Treasury held three of those auctions:
Tuesday: $69 billion in 2-year notes
Wednesday: $70 billion in 5-year notes
Thursday: a 7-year note auction
All three drew weak demand. All three “tailed” — meaning the government had to offer higher yields than the market expected to get the debt sold. The 2-year auction recorded the weakest demand since March 2025. The pattern across all three was, according to Bloomberg, the worst showing by three consecutive auctions in over a year.
Treasuries fell after a trio of US government auctions drew relatively poor demand, signaling investor fatigue with market volatility stemming from failed diplomatic attempts to end the US military operation in Iran.
In isolation, weak Treasury auctions happen. They are not automatically alarming. The mechanism exists to ensure the debt always gets sold — primary dealers, the select group of banks required to participate, absorb whatever investors don’t buy.
But the context surrounding this week’s auctions is what separates a routine data point from a genuine warning signal.
The $47 Trillion Problem Nobody Wants to Talk About
Here is the number that frames everything else.
The Treasury Department’s consolidated financial statements for fiscal 2025 show $6.06 trillion in total assets against $47.78 trillion in total liabilities as of September 30, 2025 — liabilities are 8 times greater than assets.
The US government is, by any conventional accounting standard, insolvent. Not bankrupt — sovereign governments can print their own currency in ways that private entities cannot. But the structural gap between what the government owns and what it owes has reached a level that would be catastrophic for any private institution.
The unfunded obligations — Social Security and Medicare commitments not yet reflected in official debt numbers — amounted to $88.4 trillion in fiscal 2025. The Congressional Budget Office calculates the Treasury paid $1.22 trillion in interest on the debt for fiscal 2025 alone.
Interest payments on the national debt are now the single largest line item in the federal budget — exceeding defense spending, exceeding Social Security transfers, exceeding every discretionary program combined. And that number is growing faster than the economy.
The CBO forecasts that interest costs are set to more than double to $2 trillion by fiscal 2035 from $970 billion in fiscal 2025.
A government paying $2 trillion per year in interest — in a world where oil is at $108 and climbing, where inflation is re-accelerating, where the Fed cannot cut rates — is a government with rapidly diminishing fiscal flexibility. Every dollar spent on interest is a dollar not available for defense, infrastructure, healthcare, disaster response, or economic stimulus.
This is the backdrop against which this week’s weak Treasury auctions occurred. And it is why serious investors are not treating those auctions as a routine data point.
The Iran War Made a Bad Situation Worse
The fiscal picture described above existed before February 28, 2026. The Iran war didn’t create the bond market’s structural problems. It accelerated them — and added a new dimension that the pre-war debt trajectory didn’t include.
The specter of stagflation caused by the Iran war has wiped out more than $2.5 trillion from the value of global bonds in March — on track for the biggest monthly loss in more than three years.
Here is the mechanism. When inflation expectations rise — as they have dramatically since oil spiked above $100 — investors demand higher yields on Treasury bonds to compensate for the erosion of purchasing power. Higher yields mean lower bond prices. Lower bond prices mean the value of existing bond holdings falls. The $2.5 trillion loss in global bond value this month is the direct consequence of oil at $108 and the inflation fears it is generating.
But higher yields also mean the government has to pay more to borrow. Every new Treasury auction conducted at higher yields locks in higher interest costs for the next 2, 5, 7, or 30 years. The debt service bill — already headed to $2 trillion annually by 2035 — is being revised upward in real time by every weak auction that forces higher yields.
According to Deutsche Bank strategist Steven Zeng, the biggest factor contributing to more than half of the 10-year yield’s climb is the rise in inflation expectations from the oil price shock — ultimately forcing the Fed to stay on hold with interest rates.
The Fed staying on hold means rates stay high. Rates staying high means bond prices stay depressed. Bond prices staying depressed means the next auction also faces weak demand. Weak demand forces even higher yields at the next auction. The cycle feeds itself.
This is what bond market analysts mean when they talk about a “doom loop” — and it is the scenario that keeps serious fixed income investors awake at night.
The Foreign Buyer Problem
There is a dimension to the Treasury auction weakness this week that the domestic financial press is not covering loudly enough.
The United States depends on foreign buyers — primarily China, Japan, and sovereign wealth funds from Gulf states — to absorb a significant portion of every Treasury auction. Foreign demand has historically been one of the pillars of the dollar’s reserve currency status: countries around the world wanted to hold dollar-denominated assets, and Treasury bonds were the safest and most liquid form of dollar asset available.
That pillar is under pressure from multiple directions simultaneously.
China’s Treasury holdings have been declining steadily for years as geopolitical tensions with the United States have grown. Japan, traditionally the largest foreign holder of US Treasuries, faces its own domestic interest rate pressures — as Japanese rates rise, holding low-yielding US bonds becomes less attractive relative to domestic alternatives. And the Gulf states — Saudi Arabia, the UAE, Qatar — are now embroiled in a conflict that directly involves the United States and has disrupted their own energy revenues.
Any “quiet quitting” by Chinese banks would add to growing concern that foreigners are exiting the Treasury market because of worries over the staggering size of US debt. Growing tensions with other countries on policies proposed by President Trump add to the risk.
If foreign demand for Treasury bonds declines meaningfully — not collapses, just declines — the auctions that were already producing weak results this week become harder to conduct at acceptable yields. Primary dealers absorb more. Yields rise more. The cost of financing the deficit goes up more. And the fiscal position deteriorates faster.
This is not a theoretical risk. It is a trend that is already visible in the data — and it is accelerating in the context of the Iran war.
What the Numbers Mean for Your Mortgage, Your Savings, and Your Retirement
Here is where the abstract becomes personal.
Mortgage rates: The 30-year fixed mortgage rate is directly linked to the 10-year Treasury yield. When Treasury yields rise — as they have this month — mortgage rates follow with a lag of approximately 2 to 4 weeks. Every 25 basis points of yield increase translates to roughly $30-40 per month in additional payments on a $400,000 mortgage. This week’s Treasury auction weakness pushed yields higher. That increase will appear in mortgage rate quotes by mid-April.
The buyers who were waiting for rates to come down before purchasing a home are watching rates move in the opposite direction. The owners with variable rate mortgages are watching their payments inch higher. The people who refinanced into fixed rates when they were available are the ones who made the right call — and the window to join them is narrowing.
Savings accounts and money market funds: This is the rare upside of the current bond market environment. High-yield savings accounts and money market funds are benefiting from elevated rates. If Treasury yields continue to rise — and the auction data suggests they may — the returns on short-duration cash instruments will remain elevated or improve further. Americans who have moved emergency funds and short-term savings into high-yield accounts are being paid to wait in a way that was impossible for most of the last fifteen years.
Retirement accounts: Bond funds — the “B” in a typical 60/40 stock and bond retirement portfolio — have lost significant value this month. The global bond market has shed $2.5 trillion in value during March. If you have a target-date fund or any bond allocation in your 401(k) or IRA, that allocation has declined in value. The magnitude of the decline depends on the duration of the bonds in the fund — longer-duration bonds are more sensitive to yield increases and have fallen more.
Credit card debt: Credit card rates follow the federal funds rate with a short lag. Rates at 22-24% are not declining in a world where the Fed cannot cut and Treasury yields are rising. Every dollar of credit card balance at those rates is a compounding emergency that no investment return is reliably beating.
The Signal Beneath the Signal
The bond market is sending a message this week. The message is not “the system is collapsing.” The system has enormous resilience — Treasury auctions have safety mechanisms, the Fed has tools, and the dollar’s reserve status provides buffers that no other currency enjoys.
The message is subtler and more important: the cost of ignoring the fiscal reality is beginning to show up in market prices.
For years, the United States ran enormous deficits without meaningful consequence in the bond market. Investors bought Treasuries regardless, because they were the safest asset in the world and the alternatives were worse. The bond market, as one strategist famously said, is the market that enforces fiscal discipline when politicians won’t — and for a long time, it was asleep.
This week, it stirred.
Three weak auctions in one week, against a backdrop of $47 trillion in liabilities, $108 oil, re-accelerating inflation, a Fed that cannot cut rates, and a war with no visible resolution — this is the bond market beginning to price the risk that has been building for years.
It may go back to sleep. Ceasefire talks could succeed. Oil could retreat. Inflation could cool. The fiscal situation could improve.
Or the stirring could continue. Yields could keep rising. Foreign buyers could keep retreating. Auction results could keep disappointing. And at some point — nobody knows exactly when — the gradual deterioration becomes a disorderly repricing that touches everything.
The 2022 UK gilt crisis — when a single ill-advised budget announcement caused British government bond yields to spike so rapidly that pension funds faced margin calls and the Bank of England had to intervene within days — is the model for what disorderly bond market repricing looks like in a developed economy. It happened in the UK. There is no law of physics preventing it from happening in the United States.
What Smart Money Is Doing Right Now
The institutional response to this week’s Treasury auction results has been consistent across the major macro funds.
Shortening duration. Reducing exposure to long-term bonds — which are most sensitive to yield increases — in favor of short-term Treasuries, money market instruments, and cash. The trade-off in yield is small relative to the reduction in price risk if yields continue rising.
Adding inflation protection. Treasury Inflation-Protected Securities — TIPS — adjust their principal for inflation. In a world where oil at $108 is pushing inflation expectations higher, TIPS provide direct protection against the scenario that is currently unfolding. Institutional TIPS demand has been notably elevated in recent weeks.
Increasing commodity exposure. Gold, silver, oil, and agricultural commodities historically perform well in the stagflation scenario that the bond market is beginning to price. The same macro environment that produces weak Treasury auctions — high inflation, stagnant growth, fiscal deterioration — produces strong commodity prices.
Reducing exposure to rate-sensitive equities. Technology stocks, real estate investment trusts, utilities, and other long-duration equity assets trade like bonds — they decline in value when yields rise. The portfolio rotation away from these sectors and toward energy, financials, and value stocks is the equity expression of the same thesis.
The Bottom Line for March 28, 2026
The bond market didn’t break this week. Three weak auctions are a warning, not a crisis.
But warnings deserve to be heard. And this one is coming from the most important market in the world, at a moment when the macro environment is as challenging as it has been in a generation.
The US government owes $47 trillion against $6 trillion in assets. It is paying $1.22 trillion per year in interest on that debt, a figure that will double by 2035. The war in Iran has added $2.5 trillion in bond market losses in a single month. The Fed cannot cut rates. Foreign demand for Treasuries is declining. And three consecutive auctions this week failed to attract normal interest at expected prices.
None of this is impossible to navigate. The United States has faced severe fiscal and bond market stress before and found its way through.
But finding the way through requires acknowledging the problem — and the bond market, this week, is acknowledging it louder than it has in years.
The question is whether anyone outside of the trading floors is listening.
Want to actually take action instead of just reading?
Most people understand what they should do with money — the problem is execution. That’s why I created The $1,000 Money Recovery Checklist.
It’s a simple, step-by-step checklist that shows you:
and how to start building your first $1,000 emergency fund without overwhelm.
where your money is leaking,
what to cut or renegotiate first,
how to protect your savings,
and how to start building your first $1,000 emergency fund without overwhelm.
No theory. No motivation talk. Just clear actions you can apply today.
If you want a practical next step after this article, click the button below and get instant access.
This is not financial advice. Always consult a qualified financial advisor before making significant financial decisions. If this gave you a clearer picture of what’s happening in the most important market nobody watches — share it. The people you care about need to understand this. And subscribe below for the next one.
Most people hear “$200 oil” and think: that’s an abstract Wall Street number. Something that happens on a Bloomberg terminal. Something for traders.
It isn’t.
$200 oil is a grocery bill. It’s a mortgage payment you can’t make. It’s an airline ticket that costs as much as a car payment. It’s a small business that can’t afford to deliver its product. It’s a retirement account that stops growing because the economy has ground to a halt.
And it is no longer a theoretical scenario.
Wood Mackenzie analysts said last week that Brent could hit $150 soon, and that $200 was not “outside the realms of possibility” in 2026. Iran’s own military spokesperson warned the world to “get ready” for such a spike. TD Securities published a research note last week saying oil could eventually top $200 a barrel if the conflict drags on.
As of yesterday morning, Brent crude sat at $99.75 per barrel — $26.64 more than at this time last year. Today it pushed back above $108 as Iran formally rejected the American peace proposal and Israeli strikes continued.
The five-day pause that briefly gave markets hope on Monday is already fraying. The scenario that institutional analysts are being paid to model — $200 oil — is not a tail risk anymore. It’s a live scenario with a meaningful probability.
Here is exactly what that number means for your actual life. Not for portfolios. Not for trading desks. For you.
How We Get From $108 to $200
Before the numbers, the mechanism. Because understanding how $200 happens changes how you respond to it.
The Strait of Hormuz crisis has already caused the biggest oil supply disruption in history. Brent futures nearly touched $120 per barrel as tanker traffic through the Strait effectively ceased. The IEA’s March 2026 oil market report confirms that oil prices have gyrated wildly since the US and Israel launched joint airstrikes on Iran on February 28.
The global oil market operates with a razor-thin spare capacity buffer of merely 2% to 3% above daily consumption requirements. When 8% of global energy supply is abruptly removed from the market due to hostilities, the economic consequences compound rapidly.
The mathematical path to $200 requires no dramatic escalation from here. It requires only that the Strait of Hormuz remains effectively closed for 60 to 90 days. That is all. No nuclear exchange. No ground invasion. Just the continued absence of tanker traffic through a 21-mile strait.
The IEA noted that even with an unprecedented 400 million barrel emergency reserve release agreed to by member countries on March 11, this remains a stop-gap measure — in the absence of a swift conflict resolution, it cannot bridge a sustained disruption.
If talks collapse this week — and Iran’s rejection of the American proposal today suggests that is the more likely outcome — the world finds out what sustained disruption looks like.
Your Gas Tank: The Most Immediate Impact
The national average gasoline price reached $3.79 a gallon as of last Tuesday — up about 87 cents per gallon, or 30%, from a month ago, according to AAA.
Oil at $100 already brings $5 gas — we saw exactly that pattern in 2022 after the Ukraine war began, when CPI hit 9.1% in June of that year.
At $150 oil, analysts project gasoline at $6.50 to $7 nationally — with California and other high-tax states approaching $8 to $9 per gallon.
At $200 oil, the estimated national average gasoline price hits $7.85 per gallon.
For the average American who drives 15,000 miles per year in a vehicle getting 28 miles per gallon: that’s roughly 535 gallons annually. At $7.85 per gallon, your annual gasoline cost exceeds $4,200 — an increase of approximately $2,100 per year compared to where prices were twelve months ago. That is $175 per month in additional gasoline spending alone, for a family that hasn’t changed a single driving habit.
For families with two vehicles, two commutes, and children in activities: the math is worse.
Your Grocery Bill: The Impact Nobody Sees Coming
US diesel prices have already topped $5 per gallon for the first time since 2022. That drives up trucking costs, which push up the prices of food and other goods. Volatile oil prices have a knock-on effect, driving prices higher across the entire economy, experts said.
Here is the mechanism most people don’t understand: oil doesn’t just power cars. It powers the entire agricultural and food supply chain.
Farm equipment runs on diesel. Fertilizer is manufactured from natural gas — and natural gas prices are directly linked to oil prices. Irrigation pumps run on electricity generated partly from fossil fuels. Refrigerated trucks that move food from farms to distribution centers run on diesel. The ships that import food run on fuel oil. The planes that carry perishables run on jet fuel.
Historical data is unambiguous: large and sustained oil price movements have historically coincided with changes in both food prices and broader consumer inflation. In 2022, when Brent crude surged above $120 per barrel following Russia’s invasion of Ukraine, the Global Food Price Index reached its highest level on record and world inflation rose sharply.
Pantheon Macroeconomics found that if oil prices increase to $150 per barrel and stay at that level for three months, the Consumer Price Index could jump to an annual pace of 6%, up from 2.4% recorded in February. At $200 sustained, economic modeling suggests CPI acceleration toward double digits is plausible — and the immediate macroeconomic implication is the onset of virulent stagflation: a paralyzing combination of contracting economic growth and surging consumer prices.
For a family spending $1,200 per month on groceries today: a 15% food price increase adds $180 per month to the grocery bill. A 25% increase — well within historical range for a sustained oil shock — adds $300 per month. Combined with the gasoline impact, a household can find itself spending $500 to $600 more per month on necessities alone, without changing a single behavior.
Your Utility Bills: The Invisible Multiplier
Electricity generation in the United States still depends significantly on natural gas — and natural gas prices move with oil. When oil spikes, so do electricity generation costs, and those costs flow through to your monthly utility bill with a lag of approximately 60 to 90 days.
The households that will feel this most acutely are the ones already in energy-stressed situations: families in the American South and Southwest where air conditioning is not optional, rural households dependent on heating oil for winter warmth, and working-class families in older housing stock with poor insulation who cannot afford the upgrades that would reduce their energy consumption.
Stanford economics professor Nicholas Bloom said he worries that rising oil and gasoline prices fuel the economy’s K shape — higher-income households do better and better while lower-income households fall further behind. “That, I think, is a major concern as an economist: inequality,” Bloom said during a Harvard Kennedy School webinar on the economic consequences of the Iran war.
The K-shaped economy doesn’t begin with $200 oil. It accelerates with it.
Your Flights and Travel: When the Number Hits $200
Global prices for jet fuel — a major cost component for airlines — are already up approximately 83% over the past month, according to International Air Transport Association data.
Airlines do not absorb fuel cost increases indefinitely. They pass them through as fuel surcharges, higher base fares, and reduced route options for markets that become unprofitable to serve.
At $200 oil, domestic round-trip airfares are projected to increase by $150 to $300 per ticket for most markets. International fares see larger increases. Budget carriers — the airlines that made flying accessible to families who couldn’t afford legacy carrier pricing — face existential pressure, as their model depends on volume at thin margins that evaporate when fuel costs double.
The family vacation that was budget-stretched at $3,000 in a normal year becomes genuinely inaccessible at $4,500 in a $200 oil world.
Your Job and Business: The Downstream Damage
An Oxford energy expert told Al Jazeera that $200 oil “would be a major handbrake to the world economy,” describing the prospect as “perfectly possible,” and warned it would “impact inflation, growth, employment and in some cases cause shortages of not just fuel but also materials such as fertilisers, plastics and the like.”
Plunging LPG and naphtha supplies are already forcing petrochemical plants to curb production of polymers — creating shortages of materials that flow into everything from food packaging to medical devices to construction materials.
The businesses most vulnerable are not large corporations with hedging programs and balance sheet depth. They are the small businesses — the restaurant that can’t absorb a 30% increase in food delivery costs, the landscaper whose fuel bill doubled, the small manufacturer whose plastic input costs spiked, the regional trucking company running on thin margins that evaporated when diesel crossed $5.
Ramnivas Mundada of GlobalData noted: “Even if oil prices stabilize, the persistence of higher freight costs, longer shipping routes, and insurance costs can keep delivered prices elevated for fuel and intermediate goods — and that combination increases the likelihood that inflation proves stickier than expected.”
Sticky inflation means the Fed stays hawkish longer. The Fed staying hawkish longer means rates stay elevated. Rates staying elevated means the small business loan that was already expensive becomes prohibitive. The commercial real estate refinancing that was already painful becomes impossible. The mortgage modification that was already difficult becomes a conversation that ends badly.
The cascade from $200 oil to your specific job or business depends entirely on where you sit in the supply chain — but almost nobody sits outside it.
The Scenarios Wall Street Is Actually Modeling
The institutional investment community is not operating on hope right now. It is operating on scenario trees — branching probability-weighted outcomes that determine position sizing and hedging strategies.
The three scenarios that appear most frequently in the research notes circulating among serious macro investors this week are:
Scenario One — Negotiated Resolution (30-day timeline): Talks succeed, Hormuz partially reopens, Brent falls toward $75-85, CPI moderates. This scenario is assigned roughly 30% probability by most models — reduced from 50% after Iran’s rejection of the American proposal today. In this scenario, the gas price pain is real but temporary, and the economic damage is significant but manageable.
Scenario Two — Prolonged Partial Disruption (3-6 months): The conflict continues at current intensity, Hormuz remains effectively closed, emergency reserves bridge partial supply gaps, Brent oscillates between $100 and $140. CPI settles in the 5-7% range. The Fed cannot cut rates. Small business failures accelerate. The K-shaped economy deepens. This scenario is assigned roughly 50% probability by most models.
Scenario Three — Escalation to $200 (triggered by Iranian infrastructure strikes or Gulf-wide expansion): Israeli strikes on Kharg Island or other Iranian export infrastructure, or Iranian mining of the broader Persian Gulf, triggers the supply shock that takes Brent to $150-200. CPI surges toward double digits. The Fed faces an impossible choice. Demand destruction begins — consumers reduce driving, defer purchases, cut discretionary spending. Recession probability crosses 60%. This scenario is assigned 15-20% probability — low enough to feel manageable, high enough that every serious portfolio manager has a hedge in place.
The One Number That Changes Everything Else
Here is the thing about $200 oil that the Wall Street scenario models capture mathematically but don’t fully convey humanly:
It is not a price. It is a reorganization of economic life.
At $200 oil, the decisions that seemed like personal choices — where you live relative to your job, what kind of car you drive, how often you fly, where you shop for groceries — become financial necessities or impossibilities. The optional becomes mandatory. The possible becomes unaffordable.
The households that made decisions in a $50 oil world — long commutes, large vehicles, houses far from urban centers where land was cheap — are the most exposed. Not because they made bad decisions. Because the world changed around them.
The businesses that built supply chains optimized for cheap transportation — goods manufactured far away and shipped cheaply — face a cost structure that their pricing cannot absorb.
The government faces a Fed that cannot cut rates and a consumer that cannot spend and a budget that has no room for stimulus and an energy system that has no quick fix.
Applying Blanch’s macroeconomic rule of thumb: every 1% of energy lost equates to a 1% contraction in global GDP. An 8% supply disruption implies a potential 8% shock to global economic output.
That is not a recession. That is a depression-level supply shock.
What You Can Actually Do Right Now
This post is not meant to induce panic. Panic is the response that serves you least in exactly these circumstances. But information — real, specific, uncomfortable information — is what allows you to make decisions that matter.
Here is what is actionable right now, in March 2026, while the scenario is still unresolved.
Reduce your fuel exposure now, not if prices spike further. Consolidate trips. Work from home where possible. Carpool. These are not dramatic measures — they are rational adjustments to a price signal that is already telling you something real.
Audit your variable costs. The expenses that scale with inflation — food, fuel, utilities, services — are the ones to optimize right now, before the full pass-through arrives in your bills. Pantry stocking at current prices, locking in utility rate plans where available, reviewing subscriptions and discretionary spending: boring, practical, effective.
Build your cash cushion now. High-yield savings accounts are paying 4-5% and that rate will persist in a higher-for-longer rate environment. Three to six months of expenses in liquid cash — at current inflation levels, that means a higher nominal amount than your previous emergency fund target — is the single most powerful defensive financial move available to most people right now.
If you own a business, price the risk immediately. The businesses that survive supply shocks are the ones that repriced before they had to, not the ones that absorbed margin compression until it was too late. If your cost structure has meaningful fuel or food input exposure, your pricing conversation with customers needs to happen this week, not after the next bill arrives.
If you are invested in rate-sensitive assets: the scenario that allows the Fed to cut rates and provide relief to mortgage holders, bond investors, and growth stocks requires a resolution to the conflict that is not currently in sight. Position your portfolio for the scenario that is actually unfolding, not the one you were hoping for three months ago.
The World That Was, and the World That Is
Twelve months ago, the EIA was projecting Brent crude at $55 per barrel for 2026. Gas prices were expected to fall toward $3 per gallon nationally. The Iran conflict did not exist. The Strait of Hormuz was open. The scenario being modeled in institutional risk departments was deflation, not inflation.
That world is gone.
The world that exists today has oil at $108 and rising, a Strait that has been effectively closed for 26 days, a Fed that cannot cut rates, a consumer whose confidence just hit a historic low, and a military conflict with no clear resolution pathway.
As one analyst put it: “In several respects, the conditions today could allow for an even more dramatic move than the Gulf War, given the larger share of global supply potentially at risk and the wider imbalance between supply and demand.”
$200 oil is not inevitable. But it is no longer implausible. And the gap between implausible and happening has closed faster than almost anyone predicted over the past 26 days.
The question is not whether you believe it will happen.
The question is whether you’re prepared if it does.
Want to actually take action instead of just reading?
Most people understand what they should do with money — the problem is execution. That’s why I created The $1,000 Money Recovery Checklist.
It’s a simple, step-by-step checklist that shows you:
and how to start building your first $1,000 emergency fund without overwhelm.
where your money is leaking,
what to cut or renegotiate first,
how to protect your savings,
and how to start building your first $1,000 emergency fund without overwhelm.
No theory. No motivation talk. Just clear actions you can apply today.
If you want a practical next step after this article, click the button below and get instant access.
This is not financial advice. Always consult a qualified financial advisor before making significant financial decisions. If this gave you a clearer picture of what $200 oil actually means for your life — share it with someone who needs to understand what’s at stake right now. And subscribe below for the next one.